
Analytics that help sales hit the number
See pipeline, attribution and forecasts in one governed view, and let your team ask the data where the quarter is heading.
Swiss Sovereign AI
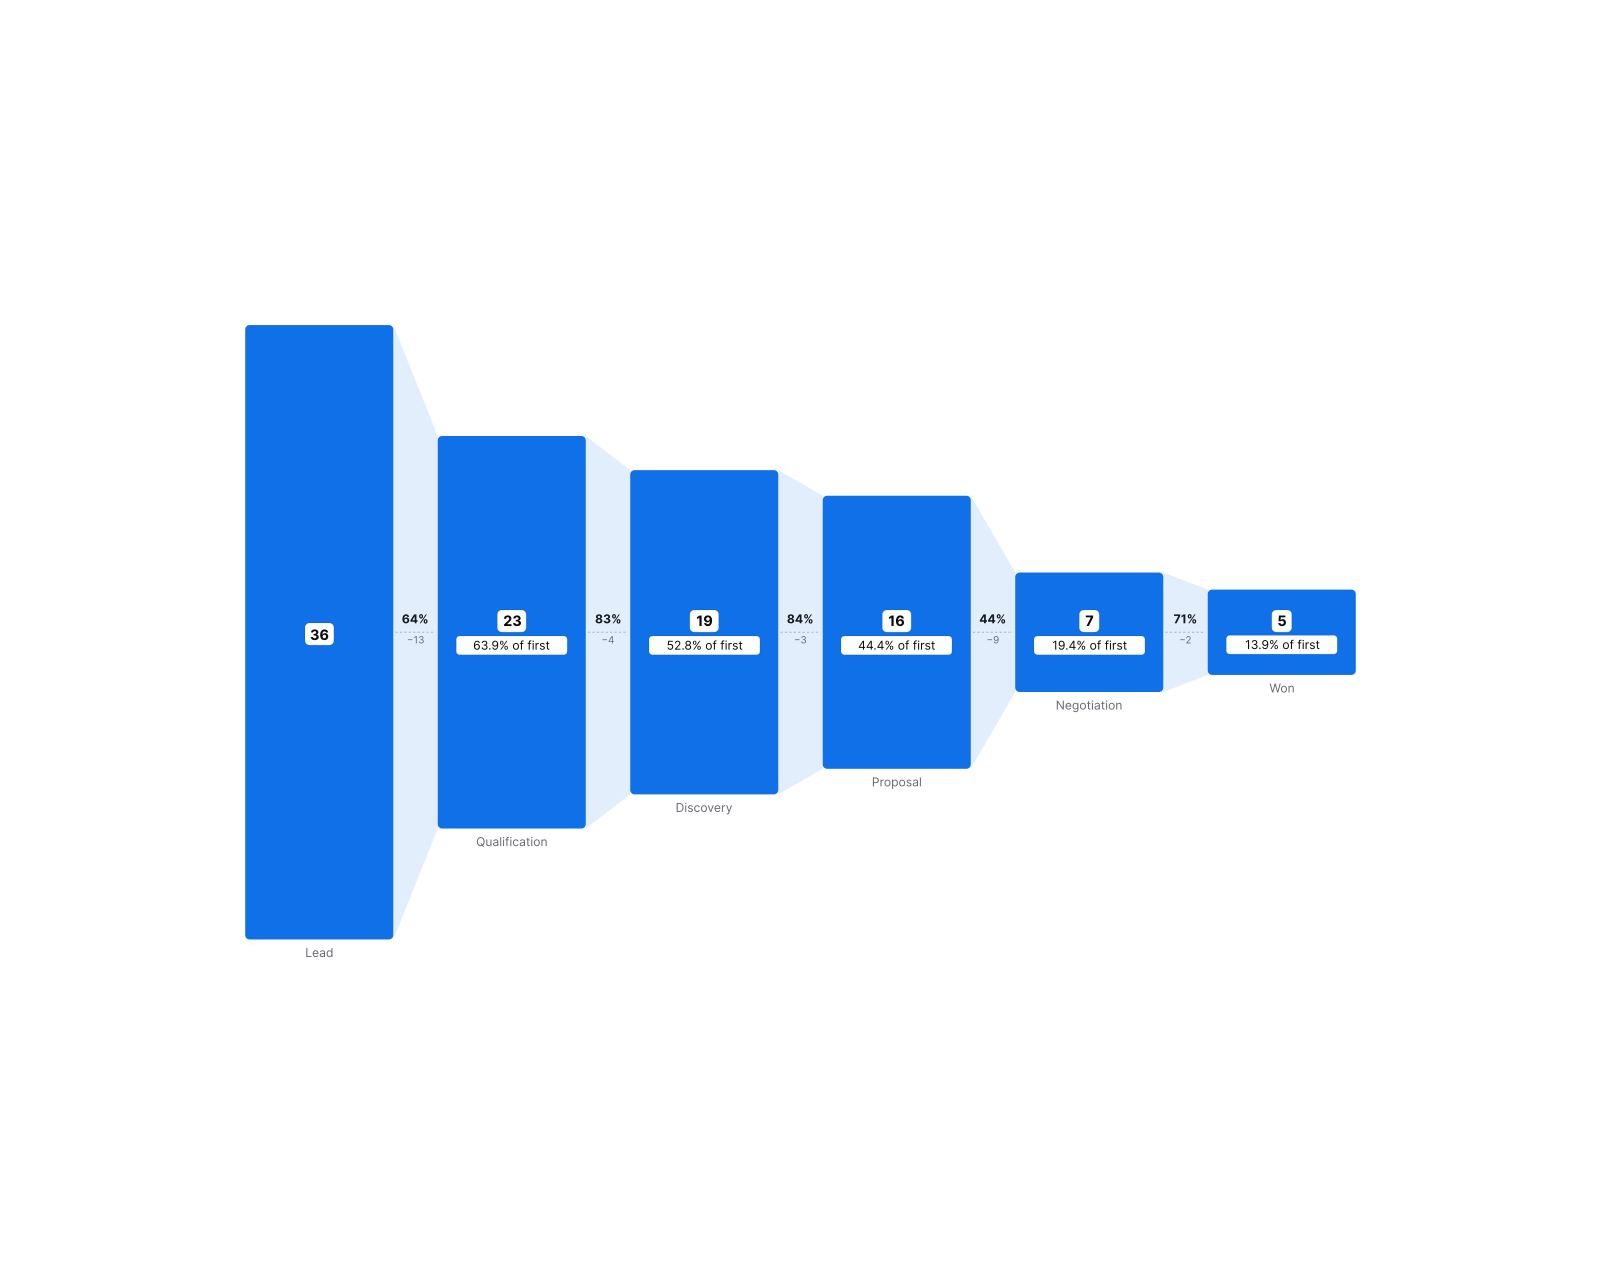
Pipeline and attribution in one view
Bring every stage, source and touch together so you can see what is really driving revenue.
- Full pipeline visibility by stage and owner
- Multi-touch attribution across sources
- One governed definition of revenue

Ask the data where the quarter is heading
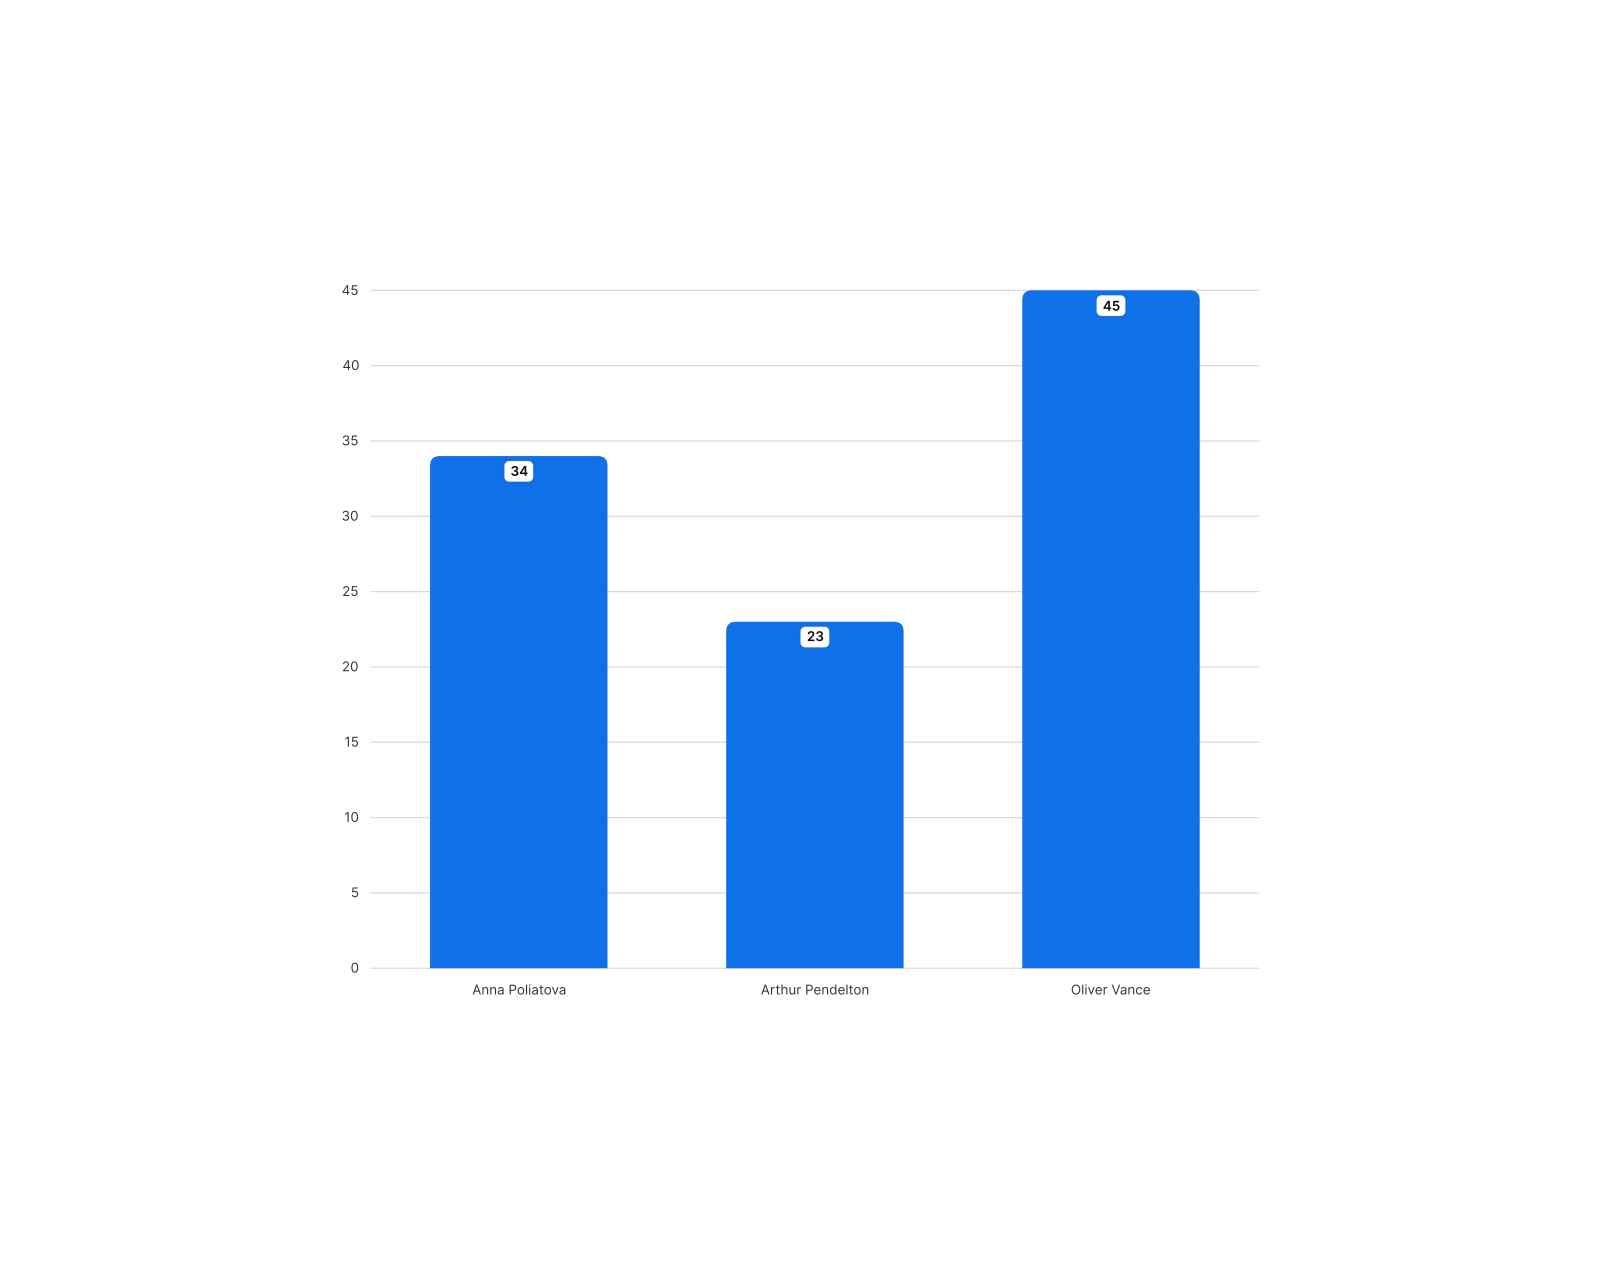
Reps and leaders get AI forecasting and answers in plain language, without waiting on an analyst.
- Ask-your-data forecasting
- Rep and team scorecards
- Natural-language answers for everyone

Why Polar
Why sales teams choose Polar
Faster forecasts
Ask the data and get a forecast without building a spreadsheet.
One source of truth
Everyone in go-to-market works from the same revenue numbers.
Swiss sovereign
Customer and revenue data stays in Switzerland.
Live demo
Try a live Polar dashboard
This is a real Polar dashboard, not a screenshot. Unlock it to filter, drill into the numbers and see how the product actually behaves.
Scrolling stays on the page until you start.